Quantcast
Channel: QSM SLIM-Estimate - SLIM-Control
Viewing all 12 articles
Browse latest View live

Using Control Bounds to Assess Ongoing Projects

$
0
0

When he created control charts in the 1920’s, Walter Shewhart was concerned with two types of mistakes:

  • Assuming common causes were special causes
  • Assuming special causes were common causes

Since it is not possible to make the rate of both of these mistakes go to zero, managers who want to minimize the risk of economic loss from both types of error often use some form of Statistical Process Control.

SLIM-Control control bounds


The control bounds in SLIM-Control perform a related, but not identical function.

Read more...


SLIM Suite 8.0g2 Is Now Available for Download

$
0
0

As our clients expand into new design disciplines, QSM recognizes their need for estimation, tracking, and benchmarking tools for domains outside of just software. Our goal with SLIM 8.0 has been to increase configurability within our tools so our clients can model any type of system quickly and easily. With SLIM Suite 8.0g2, QSM continues to expand our offerings to support different design processes and increase ease of use.

SLIM Suite.  An auto-update notification feature has been added to detect when a newer version of the SLIM Suite exists and is available for download. Enhancements have also been added so Export to PowerPoint now defaults to .pptx file format and Export to Word now defaults to .docx file format where appropriate.

SLIM-Estimate. An "Update My Project Milestones" button has been added to the WBS tab of the Work Breakdown Structure dialog box to give clients the option to replace existing project milestones defined on the Milestones tab of the Project Environment dialog box with milestones defined in the WBS. Two new SEW templates, "Call Center" and "Data Center," have been added, leveraging new Infrastructure trends.

SLIM-Metrics. A new feature has been added to File | Import Workbook Components > Reference Data tab, which allows clients to import a specific reference group (as opposed to importing all reference groups in the source workbook).

If you are a current SLIM Suite client and would like to get the latest upgrade, please contact QSM Support.

SLIM-Control support for Rational Collaborative Lifecycle Management V3 is validated as ‘Ready for IBM Rational’ software.

$
0
0

MCLEAN, Virginia – QSM, Inc., a leader in software and systems development estimation, planning, and project management, today announced that they have upgraded their integration of SLIM-Control to support IBM Rational Team Concert V3.0.1.

Rational Team Concert provides a unique team collaborative development environment enabling productivity and quality in modern software development. Project data in Team Concert, such as Work Items (stories planned; stories completed) and Quality (defects found; defects corrected) can be retrieved by QSM’s SLIM-Control to perform its project analysis:

  • Variance analysis assesses project health and progress
  • Adaptive forecasts-to-complete based on progress metrics indicated

“With SLIM-Control, our goal is to help our clients track their projects to their estimates and allow them to adapt as necessary,” says Larry Putnam, Jr., Co-CEO of QSM. “This integration allows users to bring their project data in RTC into SLIM-Control so they can quickly and easily forecast alternatives.”

“QSM’s offering, with its proven track record,” said Michael Loria, Vice President of IBM Rational Business Development, “operating on real project data in Rational Team Concert, can help our clients negotiate achievable goals, set realistic expectations and communicate more effectively with colleagues and customers in an increasingly collaborative fashion.”

The combined solution of RTC and SLIM-Control provides unprecedented potential for quality and on-time software development projects. QSM will be exhibiting at the 2011 IBM Software Innovate Conference. Please stop by Booth #409 for more information about this integration and more.

Founded in 1978 by one of the pioneers of software estimation, Larry Putnam, Sr., QSM, Inc. helps organizations measure, plan, estimate, and control software projects. It offers the SLIM (Software Lifecycle Management) Suite of tools, so managers can benchmark and forecast Agile, infrastructure, offshore/multi-shore, or ERP/package implementation projects. SLIM contains metrics from a worldwide database of more than 10,000 completed projects, enabling productivity benchmarking on the desktop. Using SLIM to dynamically run 'virtual project simulations," companies can model and forecast project releases to deliver on time, within budget with > 90% estimation accuracy. SLIM can also derive ROI achieved by Agile methods and other process improvements. QSM offers consulting and training to help accelerate this capability. Information is available at www.QSM.com.

Read more about QSM's integrations with IBM Rational Tools.

What If? The Power of the Question

$
0
0

After being away from QSM and the software world for three years, I was blown away by SLIM v8.0's dynamic product integration. I knew it was coming, yet I was still impressed by the simplicity and power of analysis promoted by real-time data and tool links across the SLIM Suite that frees managers to focus on the important program issues.

SLIM-MasterPlan is the center of the SLIM Suite product integration.  It improves upon previously existing program management features of aggregating multiple SLIM-Estimate projects and ancillary tasks with two new capabilities: 

  • Linking SLIM-Control workbooks to provide real-time project tracking and control at the program level 
  • Performing What If analysis at this higher management view to consider a wider range of potential outcomes.

The What If analysis feature is what I want to highlight.

A good personal development coach knows the "power of the question."  Questions lead to discovery, innovation, and action that brings about positive change.  Better questions lead to better answers.  SLIM's power and distinction has always been fast and easy evaluation of the impact of change, and exploring the realm of possible outcomes.  That's what we are doing when we ask ourselves "What If…?" (or our boss asks us - and we better know the answer!).  SLIM's solution logs make it easy to compare estimates, plans, and forecasts to alternative solutions, QSM trends, and your historical project database.

Now that SLIM-Control active projects can be incorporated into a SLIM-MasterPlan program, the impact of one project's performance upon dependent follow-on projects can be assessed immediately.  Let's say you decided the best way to model your current 18 month business web application was to plan 3 releases, with durations of 9, 5, and 4 months respectively.  You have created separate SLIM-Estimate workbooks for each release, and rolled them up into a SLIM-MasterPlan program.  Release 1 started 6 months ago, and you are tracking it using SLIM-Control.  Actual duration, effort, and size data enables SLIM-Control to calculate the actual PI.  Requirements and Design artifacts, plus code that's already unit tested, enable you update your size estimate.  Are the actual values for PI and Size different from the original plan?  How far off are they, and what will that variance do to releases 2 and 3? 

The What If analysis feature provides the answers you need without ever leaving SLIM-MasterPlan.  Only SLIM-Estimate tasks are available for What If.  The parameters available for analysis are:  Size, PI, and Solution Method (Peak Staff, MBI, QSM Default Solution).  You can update any or all of these parameters for individual tasks, or choose to make a Global Adjustment.  After modifying one or more task parameters, the current solution is automatically rerun via the SLIM-Estimate API and the entire program is recalculated.  Your SLIM-Estimate workbooks will not reflect the new 'what if' solution until the solution is logged and the SLIM-MasterPlan workbook is saved, so you can perform as many What If analyses as you wish without affecting the underlying workbooks.

QSM SLIM What If Screen Snap

Tracking individual project tasks is important.  But it's so easy to get lost in the details and lose sight of the real issues.  Rolling up single task percent complete values rarely provides a true picture of project health.  The speed and ease of macro-level project performance and forecast analysis found in SLIM v8.0 helps managers ask meaningful questions, and take positive action to keep their programs on track.

If you're new to SLIM, you can see more tool features in our online demo or, if you're already a SLIM tool user, check out our FAQs for more tips and tricks.

How do the uncertainty ranges in SLIM-Estimate relate to Control Bounds in SLIM-Control?

$
0
0

I am often asked this question during SLIM Training classes.  I remember wondering about that myself.  It is a logical question since SLIM-Estimate workbooks are often imported into SLIM-Control to create the baseline project plan.  The answer is ‐‐ they are not directly related, because uncertainty ranges, probability curves, and control bounds are designed to perform different tasks.  This post is the first in a series looking at risk associated with an estimate, risk of your project plan, and handling deviations from the plan.

What are we talking about?

The first thing we need to do is define some very important terms that are often misused (I am the first to admit I have been guilty!).  I went to good old Dictionary.com and looked up the following:

  • uncertainty - 1. the state of being uncertain; doubt; hesitancy; 2. an instance of uncertainty, doubt, etc.; 3. unpredictability; indeterminacy; indefiniteness.
  • probability - 1. the quality or fact of being probable (duh!); 2. a strong likelihood or chance of something; 4. Statistics. a. the relative possibility that an event will occur, as expressed by the ratio of the number of actual occurrences to the total number of possible occurrences; b. the relative frequency with which an event occurs or is likely to occur.
  • risk - 1. exposure to the chance of injury or loss; a hazard or dangerous chance; 2. Insurance. a. the hazard or chance of loss; b. the degree of probability of such loss.
  • buffer - 1. an apparatus at the end of a railroad car, railroad track, etc., for absorbing shock during coupling, collisions, etc.; 4. a person or thing that shields and protects against annoyance, harm, hostile forces, etc., or that lessens the impact of a shock or reversal; 5. any reserve moneys, negotiable securities, legal procedures, etc., that protect a person, organization, or country against financial ruin.

The simple fact that we have to estimate something means we are uncertain; we have doubt, and that makes us hesitant to commit resources to a development project.  How uncertain we are translates into risk (an exposure to losing money or customers), because we may not achieve the project goals (deliver in 12 months, or keep the cost under $2 million).  Probability is simply the likelihood of an event or occurrence.  Only in relation to insurance, is probability used to define risk (as stated above).  My personal preference is to consider them separately.  

Risk is subjective; it’s a matter of personal or corporate tolerance for potential loss, compared to potential gain.  No matter your tolerance level, everyone appreciates the security of a cushion between themselves and potential loss; a buffer.  And if any of your projects have been like the ones I managed, you may feel like you are the buffer (see definition 4.)!  For development projects, buffer is a contingency, or management reserve.  It is usually money, but can also represent schedule days or effort hours.

What is the goal?

The goal of software project estimation is to come up with a reasonable, defensible work plan, hopefully based upon past experience.  If the predicted effort and duration are in line with your known capabilities, the plan is reasonable.  

If you don't have a historical database of projects, relevant history trend lines can be substituted for your own data.  If the estimate is within +/- one standard deviation of the average, it is reasonable.

Software Project Peak Staff

The plan is defensible if the size and PI used for the estimate are based on reliable data.  Here is where the uncertainty comes in.  When we have unknowns, we must make assumptions.  In SLIM-Estimate, we can quantify the uncertainty for both Effective Size and PI.  Size is specified by entering two parameters:  the expected value (510 Objects), and range of uncertainty (no lower than 450, and no higher than 600).  With these two inputs, you can define a probability curve to account for your uncertainty.  

Your size estimate will carry more uncertainty early in the life cycle, and will depend upon how well you understand the requirements, and the rigor of your size estimation techniques. A PI calculated from your history carries less uncertainty than selecting a PI from the QSM database.

Are we done yet?

Let’s assume you have done your best to model your project’s life cycle methodology, estimate size and PI, and you’ve produced a reasonable, defensible estimate.  Your job is done if the Effort, Cost, and Duration of the proposed project meet the specified goals or constraints and are consistent with either relevant history or your own past performance.  The amount of risk associated with this estimate is due to uncertainty on the inputs, and is reported in the cost and schedule probability charts and reports.  Your work plan is the 50% solution detailed on the Solution Panel.

Software Project Risk Alas, rarely do the project constraints match our reasonable work plan.  Often more work is required to create a work plan you can commit to. 

In the next blog post, I will talk about the difference between the reasonable work plan, and the commit-to work plan (sometimes called the ‘risk-buffered’ solution) and explain why most of the work to quantify and buffer against risk is done in SLIM-Estimate.  In the third blog post, we’ll look at the definition of Control Bounds, how to configure them based upon the commit-to work plan, and the different sources of risk that arise once the project has begun.  

Creating an Effective Project Closure Checklist

$
0
0

After one particularly difficult midterm in college, my professor said, "This is just a wakeup call; there's still time to improve before the final." I think that wakeup call was particularly painful, but my professor's words stick with me today, especially when thinking about data collection (or lack thereof) when a project is over.

As someone who is not a project manager, it was difficult for me to understand why project managers would not collect their own historical data. I understand now that after a project is finished, people move on to the next project and there's no time to update project stats. Recently, I read a post on Gantthead.com by Kenneth Darter called, Project Closure: Party or Post-Mortem?. Darter says if the project was a success, then it's important to record why it was successful; if the project was not successful, it's important to capture why it was not successful.

The word "data" in Latin literally means "things having been given." At the end of a project, you have been given a lot of things that only you and your team know: size, effort, duration, staffing, PI, cost, etc. If you are able to take a moment to fully document your project information, you not only build a historical database, but you're able to reflect back on that project to improve future endeavors (whether you would like to remember it or forget it completely). Darter recommends creating a checklist which, "should be defined early on in the project and communicated to everyone who will have input into the checklist at the end of the project." In addition to project specific information, he specifically recommends these three items:

  • Scope: both the original planned scope and the scope that was met by the final result of the project.
  • Issues and risks faced by the project and how they were dealt with during the execution of the project.
  • Actual vs. Plan Data: The actual data from the project plan versus the baseline data

The idea here is to focus the project manager and provide a baseline for what kinds of information should be included in your "party" or "post-mortem." If you’re importing your project closeout information from SLIM-Control, items 1 and 3 (planned vs. actual scope and baseline vs. actual data) will come in automatically. Project issues and risks can be documented in the Significant factors area of the Review tab:

SLIM-Control Closeout Data

Every completed project is a midterm; the final is the future of your team's software development. Although your wakeup call might be painful, you can use everything you have been given to make the next wakeup call less painful until it's time to take the final.

Agile Series Part 3: Embrace Change

$
0
0

“The only thing that is constant is change” ~Heraclitus

This proverb is often told to individuals (like me) who love to see a project follow a plan from start to finish.  I’ll be honest, I’m a planner. I’m thrilled when the plans I put in motion actually work out the way I intended.  These are the moments when I retort, “the only people who like change are wet babies.” However, more often than not, something changes, which throws off my entire plan and forces me to not only revisit Heraclitus’s proverb but also rethink my plan entirely.

Building software, particularly in Agile development, is no exception. In fact, the second principle of the Agile Manifesto states that developers should: “Welcom[e] changing requirements, even late in development. Agile processes harness change for the customer’s competitive advantage.”

It would seem, then, that this principle would disappoint any planner working on an Agile team. Why bother creating a development plan if you know the stakeholders are going to change their minds about their desired features at the last minute? While we’re on this subject, if the requirements are going to change from one iteration to the next, why bother estimating the project at all?

I’ll tell you why: the bottom line still matters to stakeholders. They still want to know how much functionality to expect for the money they are spending and when that software will be delivered.  Mike Cohn illustrates this very well in his blog post about estimation in Agile projects. To summarize, he states that, “estimating is a way of buying knowledge. If having additional knowledge will lead to different decisions, then acquiring that knowledge might be a good thing to do.”  Making high-level estimates allows Agile teams to provide stakeholders with more confident predictions of the project’s lifecycle, which ultimately may affect project funding.

So now that we know why we should still do estimates despite the changing requirements, how can we do that while also satisfying your inner planner? SLIM-Control is an estimation tool that allows you to track the progress of a project while also forecasting the project’s future. By entering data about the actual progress of your project, you can predict when it will reach various milestones (See Figure 1).

Figure 1: SLIM-Control Core Metrics View

As you can see from the figure, you can track the actual project performance against the projected curve.  Anything in the green means your project is on track, yellow indicates the project is veering off track, and anything outside the yellow means the project is in trouble.

Suppose the scope of the project changes due to a last minute customer request. You can adjust your project plan in the Forecast Assumptions tab by inputting the new information, in this case changing the original 38 story points to 42 (See Figure 2).  

Figure 2: Forecast Assumptions View

This will create a new forecast which you can then convert into your new plan. As you can see in Figure 3, the dates for project milestones have changed to accommodate the change request.

Figure 3: Convert Forecast into a Plan
Figure 3: Convert Forecast into Plan

This feature allows Agile teams to make initial plans and then adjust them as requirements change. Project managers can share these forecasts with stakeholders so they know when they can expect to reach the different project milestones.

Creating high-level estimates throughout the project and tracking your progress can reduce uncertainty and help team members make more realistic plans when requirements change. Forecasts such as these will help team members manage the changing requirements, giving their customers a competitive advantage.  

So to quote Winston Churchill, “to improve is to change; to be perfect is to change often.”  I hope this post brings you more security about embracing change in your projects.

How does uncertainty expressed in SLIM-Estimate relate to Control Bounds in SLIM-Control? Part II

$
0
0

Several months ago, I presented SLIM-Estimate’s use of uncertainty ranges for size and productivity to quantify project risk.  Estimating these two parameters using low, most likely, and high values predicts the most probable effort and time required to complete the project.  This post shows you how to use SLIM-Estimate’s probability curves to select the estimate solution and associated work plan that includes contingency amounts appropriate to your risk.

Begin with an unconstrained solution

The default solution method used for new estimates, whether you are using the Detailed Method or another solution option, is what we call an unconstrained solution.  Just as it sounds, no limits have been placed on the effort, schedule, or staffing SLIM-Estimate can predict.  It will calculate the resources required to build your product (size) with the capabilities of your team (PI).  Assuming you have configured SLIM-Estimate to model your life cycle and based your inputs on historical data, you have produced a reasonable, defensible estimate.  

Solution Panel

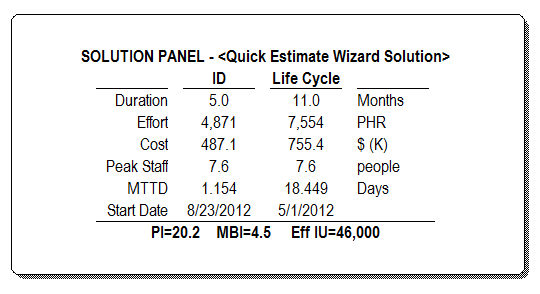
Let’s say you been asked to estimate and manage an Agile project with a size of 46,000 Implementation Units (IU), +/- 20% uncertainty.  You use a PI of 20.2 +/- 15% uncertainty from the QSM database, because your organization has not completed enough Agile projects to have your own PI value.  An unconstrained solution with these inputs results in the project plan shown in the Solution Panel.  This project is expected to cost is $755,400 and take 11 months, with a peak staff of 7.6 people.

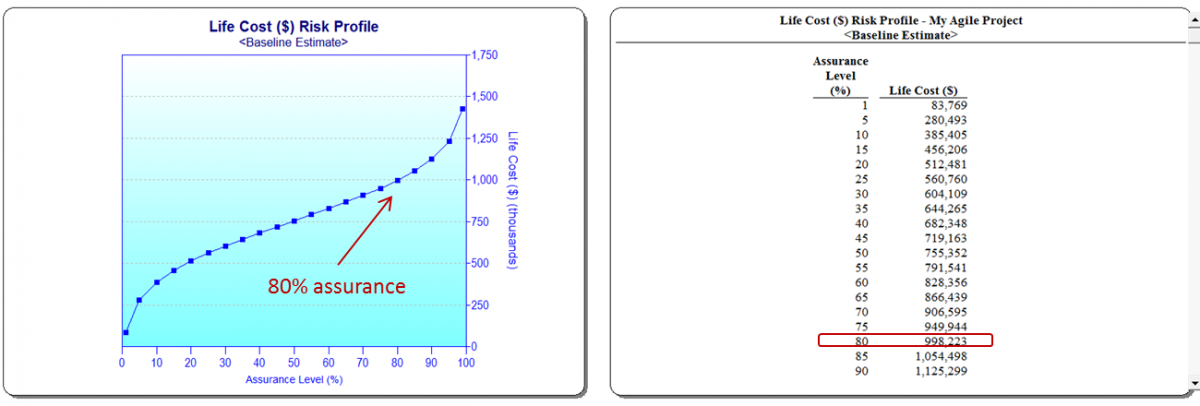
SLIM-Estimate presents the solution with the highest probability ‒ the 50% solution.  If you ran this project 100 times, 50 would take longer and use less effort, and 50 would take more effort and use less time.  This seems a little risky.  If you would like to be more confident in your proposal to your manager or customer, you have to select a work plan with a higher probable outcome.

Specify the contingency

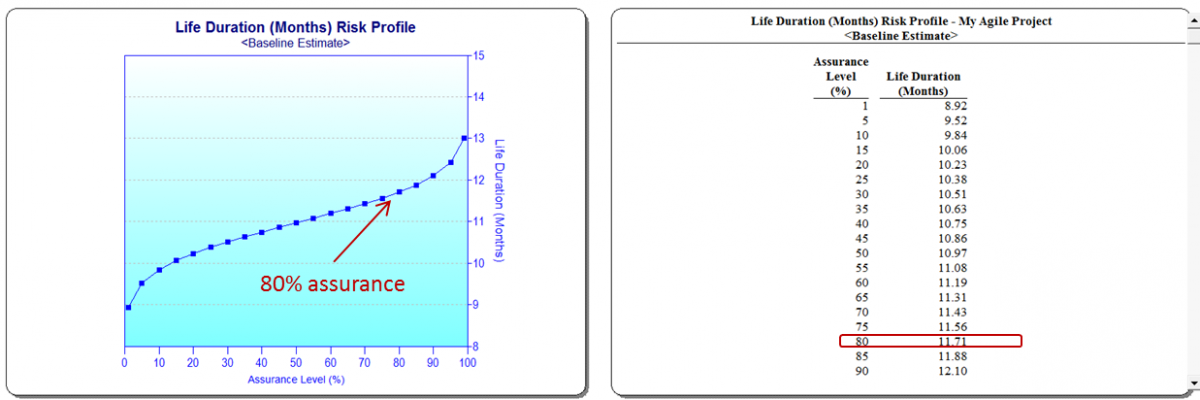
The Cost Probability Profile and Schedule Probability Profile views display curves resulting from SLIM-Estimate’s Monte Carlo Simulation, calculated using the range of uncertainty specified for size and PI.  To be 80% confident that your team will deliver on time and within budget, you need 11.7 months and $998,223.  You have calculated a specific contingency for both time and effort:  0.7 months (roughly 3 weeks), and $242,871 respectively.  

Cost Contingency
Duration Contingency

Your work plan is still the 50% solution; you plan to finish in 11 Months and hold your cost to $755,352.

Communicate the detailed work plan

Now that you have committed to the project, your next steps are to create the detailed plan and set up project tracking and control procedures.   SLIM-Estimate provides a large variety of detailed reports and charts for communicating specific development activity tasks to be performed, and the associated schedule, effort and cost expectations.  Reports can be exported to either MS Project or MS Excel, where you can add more detail to the WBS and resource allocations.

Remember that you have committed to deliver a quality product in 11.7 Months, at a cost of $998,223.  The schedule and budget reserve must be managed as the project progresses.  The time buffer is small, so you will need to watch that closely.  The budget reserve will allow you to increase effort, but you will have to balance that with the potential for added defects and rework.   In the next blog post I will show you what the SLIM-Estimate work plan looks like in SLIM-Control, and how to specify metrics and control bounds to manage the contingency reserve.


How Does Uncertainty Expressed in SLIM-Estimate Relate to Control Bounds in SLIM-Control? Part III

$
0
0

In the previous articles in this series I presented SLIM-Estimate’s use of uncertainty ranges for size and productivity to quantify project risk, and how to build an estimate that includes contingency amounts that cover your risk exposure.  In this post I will identify the project work plan reports and charts that help you manage the contingency reserve.  You will see how to use SLIM-Control bounds and default metrics to keep your project on track. 

Understand the project work plan documents.

In our example so far, you have estimated a project to deliver a software product in 11.7 Months, with a budget of $988,223.  This estimate includes an 80% contingency reserve, or risk buffer, on both effort and duration.  Your work plan is based upon SLIM-Estimate’s 50% solution; 11 Months and $755,400.  Thus, the uncertainty about size and productivity are accounted for; it is built into your plan.  The probability that you will meet the project goals is driven by many factors ‒ too many to measure.  You can only manage what is within your control, and escalate issues so they can be resolved in a timely manner.

Managing the project well begins with a solid understanding of the detailed project plan.  SLIM-Estimate provides several default and customizable charts and reports that document the plan.  Here are a few key reports1 to study in order to identify the core metrics you will want to monitor closely.

  • Gantt Chart ‒ Graphical presentation of the project task time line with milestones overlaid.  Provides insight into the relative size of major activities, overlap, and sequencing.
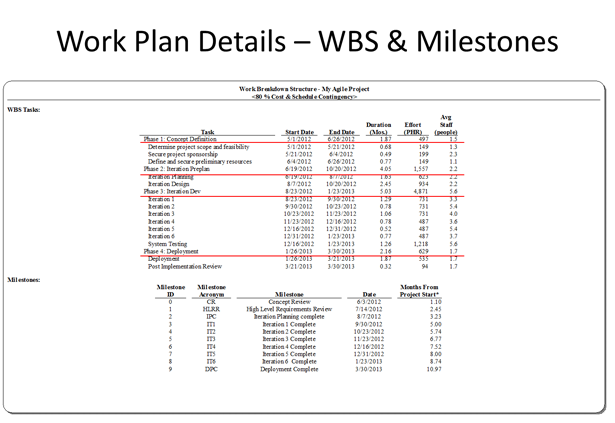
  • WBS & Milestone Report ‒ Gantt chart data.  Shows start and end dates, duration, effort, and avg. staff for phases and tasks.  Milestones are listed with planned completion date and months from start, e.g., “Iteration 3 Complete; 6.77 Months from Project Start.”

Work Plan Details - WBS & Milestones

  • Effort Rate Report ‒ Person Hours (PHR) project for each month, for the entire life cycle, or by phase.  The phase-level charts are particularly helpful in tracking effort as multiple activities are being performed in parallel.
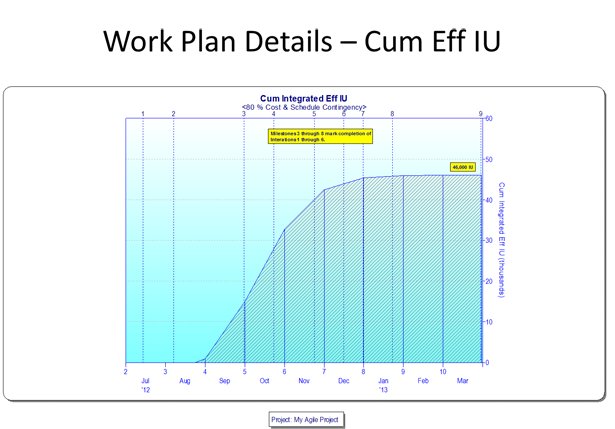
  • Cumulative Integrated Effective IU Chart and Report ‒ Shows product development progress over time.  Well-defined interim product completion milestones provide insight into the relative size of iteration builds.  Iteration completion milestones 3 through 8 on the chart below lets you compute the percent code produced with each iteration.

Work Plan Details - Effort

Reviewing the detailed project plan will help you identify specific tasks and project junctures that will require extra management oversight.  For example, the Cum Eff IU report shows that, although coding and testing span from late August to late January, the majority of functionality is produced in the first three of six iterations.  Schedule delays during in those first iterations will be costly. 

What can SLIM-Control track?

SLIM-Control allows you to track plan versus actual data for all of the metrics described above, plus unlimited custom metrics.  Plan values for default metrics are set up when you import your SLIM-Estimate work, including the following:  

  • Phase Start and End Dates
  • Milestone Dates
  • Staffing, either Avg. Staff or Effort (Rate or Cum)
  • Cum Effective Size
  • Defects, by Category

You may want to track other metrics, such as the number of test cases successfully executed, the number of requirements completed each iteration, requirements changes, etc.  Use what you know you don’t know to define custom metrics to guide metrics data collection and analysis efforts.

Using control bounds and other analysis tools

Getting back to the original question, “how does uncertainty expressed in SLIM-Estimate relate to control bounds in SLIM-Control?”  I wrote in the first blog post that they are not directly related; uncertainty ranges, probability curves, and control bounds help you quantify and manage different project characteristics. Collecting and analyzing core metrics as the project progresses is the best way to know if you are going to meet the project goals, or if not, how much time and budge contingency you will use.  Control bounds are simply a visual technique for identifying deviations from a reasonable range around your plan.   What is acceptable and what is unacceptable?   Only you can decide, based upon your analysis of the detailed work plan mentioned earlier.

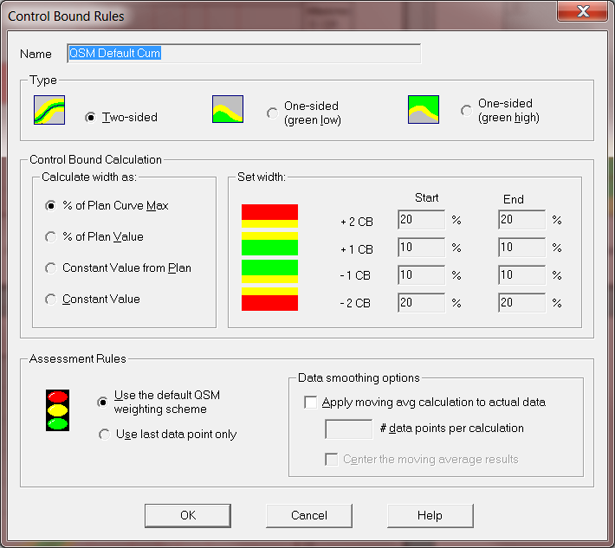
There are several options for configuring control bounds within SLIM-Control.  The type of curve you select, whether two-sided, one-sided, or constant value, depends on the particular metric you are tracking.  The most common metrics will be tracked as either rate or cumulative values over time.  There are separate QSM default control bound settings for each.  You can change the type and how the green, yellow, and red bounds are calculated.

SLIM-Control Control Bound Rules

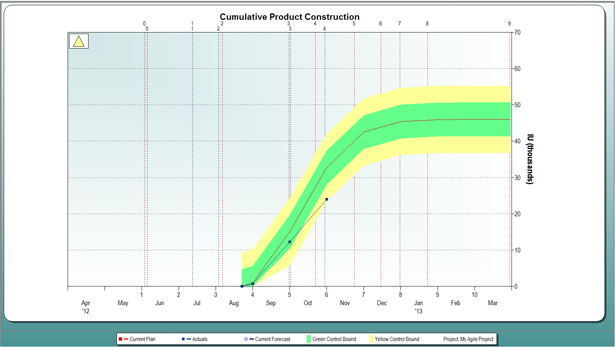
The chart below shows planned versus actual Cumulative Product Construction.  At this stage in our sample project, product construction is behind schedule.  The yellow assessment symbol in the top left corner, computed from the control bounds for this metric, indicates that some corrective action is needed.  The assessment was green for three months prior.  Should the control bounds have been configured differently to provide earlier warning?  Well, the default for cumulative metrics is +/-10 of the Plan Curve Max on both sides of the plan curve.  With Eff IU of 46,000, that translates to +/- 4600 IU deviation every month.  You may want to narrow the range of acceptable deviations earlier in the phase, or change the type to % Plan Value.  Perhaps a better option for this project would be to report actuals on a weekly rather monthly basis.  That is more in line with Agile development schedule and practices.

Cumulative Product Construction

Reviewing the control bound settings to ensure they match your risk tolerance will increase your trust in the assessment reports.  You will be equipped to react in a timely matter, before the project veers too far off track.  It will also keep you from over reacting to normal variations.  Actual data will deviate from the plan.  It is up to you set determine how much is acceptable.

Take advantage of the project snapshot feature and various assessment reports to get a bird’s-eye-view of project performance.  Run forecasts to calculate estimates to complete when variations are significant.  Reducing project risk and increasing your probability of success is directly tied to your metrics collection process, and what you do with the results.  Not only will SLIM-Control help you effectively track and control the project, you will also have a rich set of completed project data upon which you base your next estimate.  So, perhaps it turns out that the best risk buffer is you (“a person or thing that shields and protects against annoyance, harm, hostile forces, etc., or that lessens the impact of a shock or reversal”)!  Just kidding, but good processes backed by good tools and well-defined reserve will increase your software development project success.


All SLIM charts can be toggled to reports. You can customize set the default setting for each view.

Customizing SLIM Suite Workbooks

$
0
0

Although each workbook is set up with default themes, the look and feel of SLIM-Estimate, SLIM-Control, SLIM-Metrics, and SLIM-MasterPlan workbooks are readily customizable.  

Default workbook settings

Screen Background

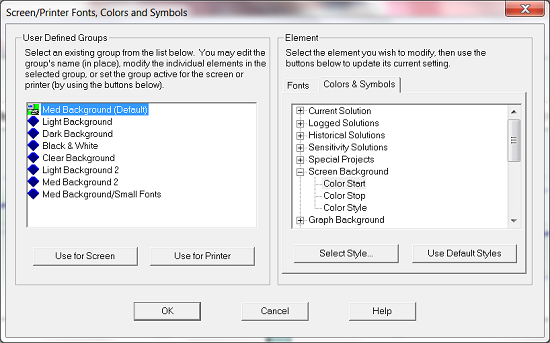
The easiest way to change the feel of your workbooks is to change the background color and style.  To change the background color, go to Tools|Customize Display|Screen/Printer Fonts, Colors, and Symbols…, then go to the Colors & Symbols tab on the right.

Screen/Printer Fonts, Colors, and Symbols

Color Start and Color End are important if you want to create a gradient background, like the background in the first image.  A gradient background begins with your specified Color Start color then transforms into your Color Stop color either vertically, horizontally, or diagonally (pictured above).  If you choose the Solid color style, simply select your Color Start.

Graph Background

Like the Screen Background, you can have a solid background or a gradient.  Simply follow the steps above for selecting your colors and styles.

Solutions and Reference Data

You can select the color and symbol used for solutions, data points,  and reference groups by using the Colors & Symbols tab.  There are 10 different symbol types that come in small, medium, or large.  You can choose colors from pre-selected palettes or create custom colors.

Fonts

Font dialog box

You can change the fonts for many of the chart and axes labels, as well as noteboxes, headers, footers, and more.  Go to Tools|Customize Display|Screen/Printer Fonts, Colors, and Symbols…, then select the Fonts tab on the right.  Changing the font can help update the look of your workbooks, but you can also play with the font style and color to match your theme.

User Defined Groups

Screen/Printer Fonts, Colors, and Symbols

In addition to being able to customize workbooks, you can also take advantage of a few pre-packaged themes.  To check them out, go to Tools|Customize Display|Screen/Printer Fonts, Colors, and Symbols….  On the left side is a list of pre-packaged themes that you can use for viewing on your computer or for when you print.  It might be easier to use one of the pre-configured themes as a starting point for making your changes.

Dark background theme

Dark background pre-packaged theme

Importing Your Customized Theme into Other Workbooks

Import Workbook Components

Once you have customized your workbook to your liking, you can easily import those settings into other workbooks.  Simply open a new workbook, select File|Import|Workbook Components.  In Step 1 of the dialog box, check Colors, Symbols and Fonts (Replace only), then in Step 2, select Import from an existing workbook, then browse to your workbook, then click OK.  Your customized fonts, colors, and symbols will replace the default workbook's fonts, colors, and symbols.

How to Use Big Data to Improve Your Software Projects

$
0
0

In the recent Washington Post article How the Obama Campaign Won the Race for Voter Data, Joel Kowsky writes about how the 2012 Obama campaign used analytics to improve their campaign strategy, and to ultimately secure the presidential victory.  

Regardless of where you stand on the political spectrum, it’s hard to argue that Barack Obama’s campaign strategy was anything short of impressive.  As soon as Obama took office in 2009, his team began preparing for his 2012 campaign.  From the start there was a strong emphasis on measuring the campaign’s progress.  Jim Messina, Obama’s 2012 campaign manager, stated 

“There’s always been two campaigns since the Internet was invented, the campaign online and the campaign on the doors.  What I wanted was, I didn’t care where you organized, what time you organized, how you organized, as long as I could track it, I can measure it, and I can encourage you to do more of it.”

The team began by conducting a postmortem study on their 2008 campaign where they analyzed the number of homes visited, phone calls placed, and voters registered by each field organizer and volunteer.  The result was a 500 page report which highlighted areas of improvement for the 2012 campaign.  

The suggestions led the Obama campaign to invest in building customized software that would integrate all the data the campaign had collected on voters, donors, and volunteers and link to individual voter profile.  This software analyzed previously collected data to calculate the likelihood of candidate support, the likelihood of election day turnout, and the degree of persuasion for each voter.  

The campaign used this information determine the most efficient use of funds and volunteer time.  Obama’s chief Ohio strategist, Aaron Pickrell, told a story which illustrated the difference between how the two campaigns allocated resources.  

“An Obama volunteer knocked on his door during the summer, just to check in and see if he had any questions.  The volunteer did not know who Pickrell was.  He knew based on the campaign data, only that Pickrell should be a solid Obama voter, someone who needed to be contacted once at most.  Pickrell and his wife later ordered absentee ballots.  When the ballots arrived, they set them aside on the kitchen table, where they sat for two weeks.  ‘I got thrown back into the database of people who needed to be contacted,’ he said.  Soon an Obama volunteer knocked on their door to remind them to turn in the ballots.  Once they did, there was no more contact.  That was the level of the campaign’s efficiency.  Meanwhile Pickrell said he received a dozen direct-mail pieces from the Romney campaign, a waste of money and effort on the Republican’s part.  He got no direct mail from the Obama campaign because the database said he didn’t need persuading.”

Knowing that so much was at stake, the 2012 Obama campaign maximized their efficiency to execute a remarkably successful campaign effort.  However, using Big Data is not limited to political campaigns.  Estimating software projects can benefit from this approach as well.  

One of the most important elements of the Big Data approach to software development is collecting good data.  A good place to start is with your completed projects.  You can input the project’s start date, end date, expended effort, and peak staff, as well as any additional metrics you may have collected into SLIM-DataManager.  As current projects wind down, you can conduct a postmortem upon completion of a project where you can collect data on all the metrics of interest.  Additionally, you can use the review tab to enter completed project data for schedule, effort, cost, and size growth to calculate schedule slippage and overrun.

While there may be little incentive to take the time to conduct a postmortem for your previous project instead of immediately starting the next one, taking time to reflect on what you did well and what needs improvement is valuable for planning future projects.

Once you have a database of projects (the more the better) you can analyze them using SLIM-Metrics.  Perhaps you’re interested in looking at how team size affects productivity.  Using SLIM-Metrics, you can build queries to group your projects into small teams (i.e. <5 FTE) and large teams (> 10 FTE).  You can then plot these groups on a Size vs. PI chart to determine which trends show greater Productivity.

If your organization has at least 30 completed projects, you can use that data to create custom trend lines to use in your analyses.  Creating custom trends is beneficial to estimating future projects because it will give a more accurate representation of what your organization has accomplished in the past.  

You can even take this customization one step further by building custom templates.  Custom templates are regular SLIM-Estimate files that have already been calibrated to your organization’s software lifecycle.  They usually are based upon your typical projects as a model for estimating future projects.

If you collect data throughout the course of your project, you can even use it to track its progress.  SLIM-Control allows you to forecast the most likely delivery date, cost, and reliability of a project.  At various points during the project you can enter actual data and compare it with the project plan.  If the project begins to veer off schedule you can reforecast and use the updated information to adjust/ update a new plan.  Collecting metrics while the project is in progress will allow you to make more accurate predictions about the project outcome.  

If you want to take a Big Data approach to software development, the SLIM Suite can provide you with the tools to estimate, track, and analyze software projects.  Just like the Obama campaign, SLIM allows you to collect data on your completed projects, analyze it so you can learn your strengths and weaknesses, use that information to set goals for future projects by designing custom templates, and then track the progress of your project throughout the software lifecycle.

Resource Demand Management - Are the Right People Working on the Right Thing?

$
0
0

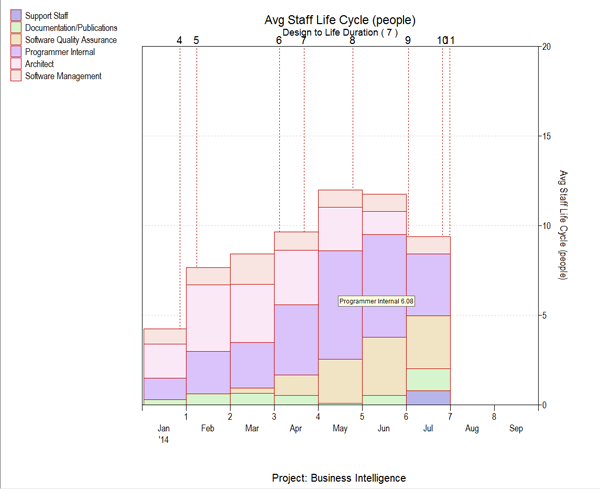
I am excited about the resource demand management capabilities in our newest SLIM-Estimate release (8.2). Software project estimates can now provide a breakout of Full Time Equivalent (FTE) staffing requirements by role by month. The staffing profile below shows how different roles, or skills, are required at different points in the schedule, based upon a particular development methodology. You can see that 6 FTE Programmers are needed by the month of May. Producing a high-level, scope-based estimate early in the software development lifecycle with detailed resource demand data helps the PMO and portfolio managers determine the best timing for project resource allocation, and setting project start dates that maximize productivity and reduce bottlenecks.

Software Resource Demand Management

Once the estimate and resulting project skills allocation plan has been approved, resource demand management has not ended. Tracking actual staffing at the skill and task level for in-flight projects not only ensures the right people are working on the right things, meaning that product development is on track, it also allows timely resource plan adjustments to address unforeseen staffing needs.

QSM’s SLIM-Control tool uses plan versus actual variance analysis of key project metrics beyond cost and schedule, particularly interim and deliverable product measures, to show true project status. Any metric can be used in tracking and forecasting, including team skill sets. This blog post demonstrates how tracking plan versus actual key resources allows timely adjustments to project and portfolio level resource allocation plans.

Resource Demand Management

A medium size business intelligence project was estimated using SLIM-Estimate. Based on the organization’s typical project makeup for this type of effort, a template was configured to set points in the lifecycle where the level of various team resources shift. Each Skill Category can be specified as either a percent of total effort required for a portion of the schedule (time slice) or as a number of FTEs.

Resource Demand Management Staffing Assessment

The staffing profile shown above is one of the key outputs from SLIM-Estimate that can be exported to spreadsheets, PPM tools, or elsewhere to support resource demand management. The staffing report (all SLIM Suite charts can be converted to reports to view or extract the underlining data) was exported to create a custom staffing plan in SLIM-Control. SLIM-Estimate workbooks can be imported into SLIM-Control to generate detailed plans for core metrics, however, skill categories are not included. Custom Metrics were added to the default plan to track four key skills for this project: Software Management, Architect, Programmer Internal, and Software Quality Assurance.

Control bounds define acceptable (green), cautionary (yellow), and serious (outside yellow bound) actual deviations from the plan. A similar set of tracking curves for product measures help project managers identify potential schedule slip situations, since late completion of early lifecycle products, such as Use Cases, are strong indicators that subsequent, dependent products will also be late.

Resource Demand Management

Five months into the project we see that product development is behind. The delivered product (Cum Eff IU) is in the red zone, but just barely. Surely the team can buckle-down and get back on track! QSM experience shows this is highly unlikely. The use cases were completed one month late, and the design components are behind as well. What is the source of the problem? The FTE Staff chart shows fluctuations, however, the overall status indicator is in the green. A look at actual FTE staff by skill shows that we do not have the right people working on the right things.

Resource Demand Management

The project is short on architect resources and heavy on programmers. Perhaps after seeing that the architects would be held up on another project, the software manager hoped the programmers would have the capabilities to fill in for a couple of months.

Now that the project situation is understood, what can be done? SLIM-Control’s forecasting capability uses product, milestone, and staffing metrics to predict a project completion date based on actual performance. This is shown by the line with white squares in the Staffing Assessment chart. This forecast assumes no changes in the original scope or resource requirements, and does not include defects. It is likely that the code developed so far contains requirements and design defects, because the programmers do not have the same skill sets as the architects. The software manager will want to track this project closely from now on.

Tracking actual resource availability not only enables the manager to see that the project will be at least two months late, she can update the resource plan with specific information about the skill sets required for the duration, enabling resource managers to reassess demand across the organization.

Viewing all 12 articles
Browse latest View live